Check out this graph of residential real estate values, inclusive of single family homes and condos, based on Price per Square Foot for the city of Boulder over the past 3 years.
You’ll see that values remained relatively stable over the course of 2014 at around $250-260/SF. Then in Jan of 2015 property values, based on sales, made a distinct jump to $287/SF and ended up averaging around $300/SF the rest of the year.
Is This The Next Big Price Increase?
In February of 2016 we saw a similarly large jump, up to $340/SF. If this increase holds up and follows a similar trend to the Jan 2015 jump, we are probably looking at a near term average pricing of $350/SF for 2016.
I reviewed the data (that is the residential real estate sales) for February 2016 in Boulder and this appear to be a broad-based increase, covering ~62 property sales. Further, I looked at each of the 62 properties and could not identify any high outliers. The only outlier was from the Boulder Affordable Housing Program and was on the low side (and it was significantly lower).
What does this mean for you?
Overall, expect to pay more (or get more) for housing in Boulder. In the short term, if the pattern from 2015 repeats, pricing for March will be a bit lower than go even higher in April. So buy immediately and wait to sell until April.
If you want to speak with me about your Real Estate needs, give me a call: Brandon 720-352-5633
In this series we are taking a look at how quickly homes in various parts of Boulder and nearby communities have been selling & how close to asking the purchase price is. Each article takes a look at a different area and adjusts the data set criteria for that zone.
For segment #2 I thought we would look at downtown Boulder. Downtown is the largest high-price (per square foot) area of Boulder with a diverse housing stock of condos both old and new, single family detached homes, student rentals, landmark properties, apartments and even a few trailers. The high valuations are primarily driven by scarcity and desirability of the area. Because there are a lot of old and not-updated properties, high end finishes get you a double bonus here. That said, most of the properties included in this data set don’t have high-end finishes. Additionally, many of these properties are rentals.
For this data set I had to up the purchase price limit to under $1 Million as the lowest sale price in this zone over the past year was $543,000. Even at that we only got 15 sales in this area. In fact there were more sales over $1,000,000 (18) than under. That’s about as entry level as it gets downtown.
Data Set Criteria Quick Look
Listing Price: below $1,000,000
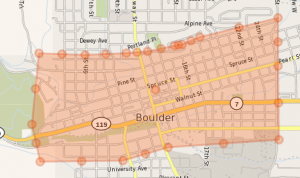
Area: Downtown Boulder (see map below)
Time Frame: from Nov 2013 though Oct 2014 (12 months)
Housing Type: Detached, Single Family (meaning no condos, no apartment buildings, though this will sweep in rentals with mother-in-laws and the like)
Data Set Map
Downtown Boulder Area Boundaries for this Real Estate Sales Data Set
Sales Velocity
Sales Velocity
# of Sales
Average DOM
Average DTS
Average DTO
Totals
19
77
86
53
This is quite a bit slower than the South/East Boulder data we looked at last time where the average DTO (days-to-offer) was 27 days less at 26. While notably lower, 53 days is still respectably quick. With such a small data set outliers may have an outsized effect, let’s take a look:
A review of the data shows only 4 significant outliers, 1 that was very short, entered as sold in 1 day. Agents often do this to get the data into the MLS when the sale is out of market. In this case the agent found a buyer before putting the house on the market. There were also 3 houses that had really long sales times of 144-318 days. These homes typically were over-priced but stayed on the market long enough to get close to what they wanted.
If we remove these 4 outliers we get an average days-to-offer of 25 which is even better than the the south/east Boulder numbers.
This offers a clear lesson to sellers on 2 points:
1. If your home is priced at market, it will sell quickly
2. If you want to get a price above market, just wait a year and you’ll probably get it (though one of the long DTOs did take a nearly 10% haircut on their price, it was a very run-down property)
Home Sales Price Impact
Sold Statistics
Count
High
Low
Median
SP/LP
Totals
19
$973,000
$515,000
$719,600
99.23%
As with our previous data set we are still looking at a 99%+ ratio of sales price to listing price. This is primarily a function of how hot the market is and a signal that we have not yet peaked. So let’s keep on selling!
If you have had even a small interest in buying or selling a home in Boulder over the past couple of years you have probably realized that the market is and has been extremely popular. Most people get this information by hearing about a neighbor’s or friend’s home that has sold extremely quickly and/or for more than the listing price. I thought it would be interesting and useful for both buyers and sellers of houses in Boulder and the surrounding towns like Louisville, Lafayette and Longmont to see just how popular the different parts of Boulder are and how nearby communities compare. Rather than using anecdotes I will rely on data from the MLS (Multiple Listing Service) to give us a clearer, data driven picture of what is happening in the market.
I’m going to call this an analysis of “sales velocity”, because we will primarily be looking at how quickly properties sell, regardless of the inventory of homes available. We will also look at pricing because this is extremely important to both the real estate buyer and seller. I plan to do this analysis as a series, with this first article focusing on South Boulder houses and then moving to different zones within Boulder and then onto nearby communities.
I also thought we would look at only entry level housing to begin with, since an entry level house in Boulder would be about as valuable as a castle in Indianapolis, where I grew up. I will also be limiting this initially to detached single family homes, that is, not multi-family or condos. Along the way, if anyone is interested in getting data on a different set of housing or a neighborhood I’ll likely skip over, like Mapleton Hill, let me know in the comments and we can explore those data sets as well.
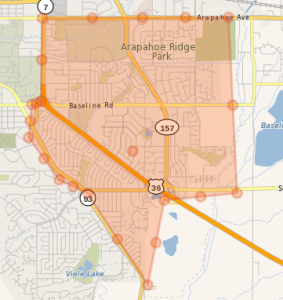
To begin with, let’s define the area we are looking at today – below you can see the map I’m using. The data is drawn from within the reddish shaded zone. This encompasses an area that attracts family owners and student renters. The homes are modest, mostly built in the 60’s and 70’s and range from original finishes (not good) to fully renovated and popped. Many of the sub $700,000 homes in this area are not-at-all, somewhat or fully updated but not usually expanded in square footage. The typical updates are at the moderate end of things, not extravagant.
Data Set Criteria Quick Look
Listing Price: below $700,000
Area: South and South East Boulder (see map for details)
Time Frame: from Nov 2013 though Oct 2014 (12 months)
Housing Type: Detached, Single Family (meaning, no condos, no apartments)
Data Set Map
South and East Boulder Area Boundaries for this Real Estate Sales Data Set
First, let’s look at how quickly homes in this defined group sell:
# of Sales
Average DOM
Average DTS
Average DTO
Totals
154
53
63
26
Wow, that’s fast! Only 26 days average to get an accepted contract. and yielding 53 average days on the market. Homes are considered to be on the market until the sale is finalized at closing, so the home is still on the market after an offer is accepted. By comparison the national average is around 90 days on the market. Interestingly, one area that has an even higher velocity than Boulder is the Denver market with an aggregate DOM of only 37 days! that means homes sell within a week of listing on average. I took the Denver data from here.
Next let’s look at how much these homes sold for relative to their listing price.
Sold Statistics
Count
High
Low
Median
SP/LP
Total
122
$686,000
$257,269
$470,000
99.00%
Another eye-popper – these homes sold for an average of 99% of the listing price. Which is the expectation with such a short time to an accepted offer, you would anticipate that the offers are fairly close to and often above asking as the market to purchase is highly competitive.
Well, no surprises here, the Boulder real estate market is fully back based on velocity and valuations. Next we’ll look at another area of Boulder to see if there is any difference in popularity of areas around the city.
I hope this is helpful and interesting to you. In the comments please leave ideas for future posts and criticism of this one.
Real Estate Services in Boulder, Louisville, Superior, Lafayette, Longmont and Unincorporated Boulder Co.