In this series we are taking a look at how quickly homes in various parts of Boulder and nearby communities have been selling & how close to asking the purchase price is. Each article takes a look at a different area and adjusts the data set criteria for that zone.
For segment #2 I thought we would look at downtown Boulder. Downtown is the largest high-price (per square foot) area of Boulder with a diverse housing stock of condos both old and new, single family detached homes, student rentals, landmark properties, apartments and even a few trailers. The high valuations are primarily driven by scarcity and desirability of the area. Because there are a lot of old and not-updated properties, high end finishes get you a double bonus here. That said, most of the properties included in this data set don’t have high-end finishes. Additionally, many of these properties are rentals.
For this data set I had to up the purchase price limit to under $1 Million as the lowest sale price in this zone over the past year was $543,000. Even at that we only got 15 sales in this area. In fact there were more sales over $1,000,000 (18) than under. That’s about as entry level as it gets downtown.
Data Set Criteria Quick Look
Listing Price: below $1,000,000
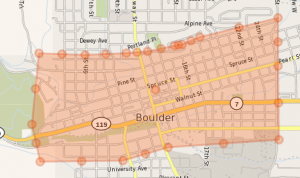
Area: Downtown Boulder (see map below)
Time Frame: from Nov 2013 though Oct 2014 (12 months)
Housing Type: Detached, Single Family (meaning no condos, no apartment buildings, though this will sweep in rentals with mother-in-laws and the like)
Data Set Map
Sales Velocity
| Sales Velocity | # of Sales | Average DOM | Average DTS | Average DTO |
|---|---|---|---|---|
| Totals | 19 | 77 | 86 | 53 |
This is quite a bit slower than the South/East Boulder data we looked at last time where the average DTO (days-to-offer) was 27 days less at 26. While notably lower, 53 days is still respectably quick. With such a small data set outliers may have an outsized effect, let’s take a look:
A review of the data shows only 4 significant outliers, 1 that was very short, entered as sold in 1 day. Agents often do this to get the data into the MLS when the sale is out of market. In this case the agent found a buyer before putting the house on the market. There were also 3 houses that had really long sales times of 144-318 days. These homes typically were over-priced but stayed on the market long enough to get close to what they wanted.
If we remove these 4 outliers we get an average days-to-offer of 25 which is even better than the the south/east Boulder numbers.
This offers a clear lesson to sellers on 2 points:
1. If your home is priced at market, it will sell quickly
2. If you want to get a price above market, just wait a year and you’ll probably get it (though one of the long DTOs did take a nearly 10% haircut on their price, it was a very run-down property)
Home Sales Price Impact
| Sold Statistics | Count | High | Low | Median | SP/LP |
|---|---|---|---|---|---|
| Totals | 19 | $973,000 | $515,000 | $719,600 | 99.23% |
As with our previous data set we are still looking at a 99%+ ratio of sales price to listing price. This is primarily a function of how hot the market is and a signal that we have not yet peaked. So let’s keep on selling!